
EVERY WEEK, WE’RE OUT TESTING THE WATER YOU SWIM, PADDLE, AND FISH IN
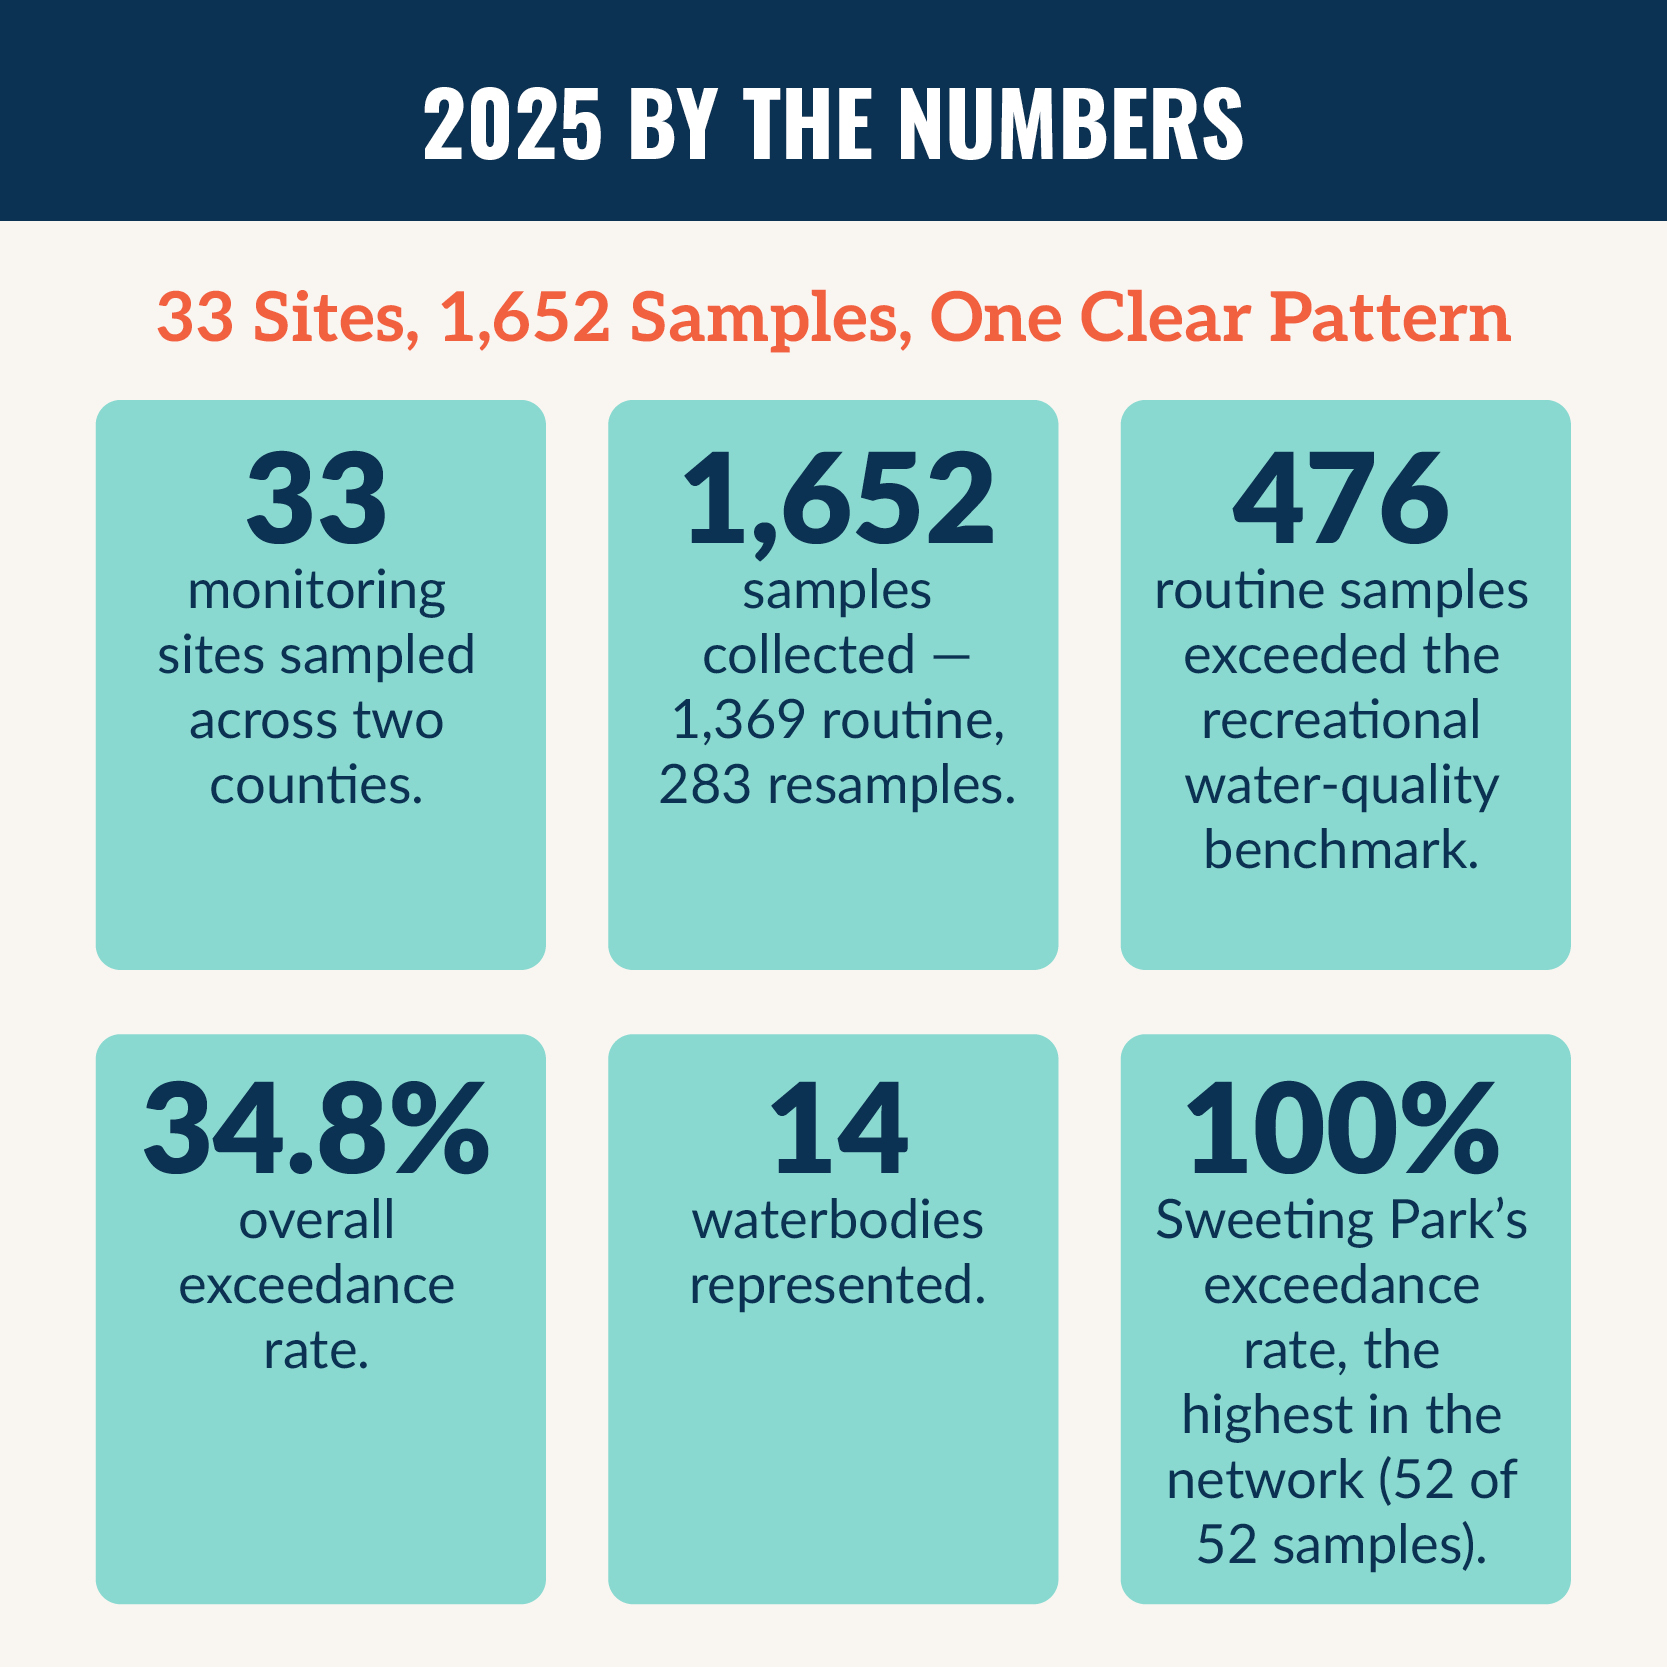
This report explains what enterococci results mean, how to understand a red Swim Guide result, and how rainfall, environmental conditions, and source tracking can help identify where follow-up action may be needed.
Miami Waterkeeper tests recreational waterways across Miami-Dade and Broward counties each week so residents, visitors, and decision-makers have timely information about local water quality.
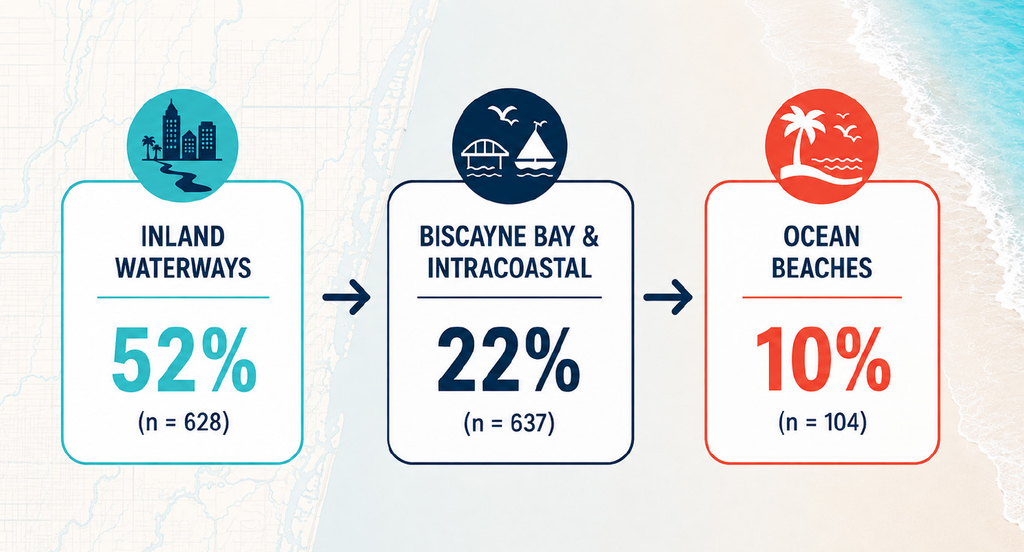
In 2025, elevated bacteria levels were most common in inland waterways. About 52% of routine samples from rivers and canals were above the Florida Healthy Beaches Program benchmark, compared with 22% from Biscayne Bay and Intracoastal waters and 10% from monitored beaches.
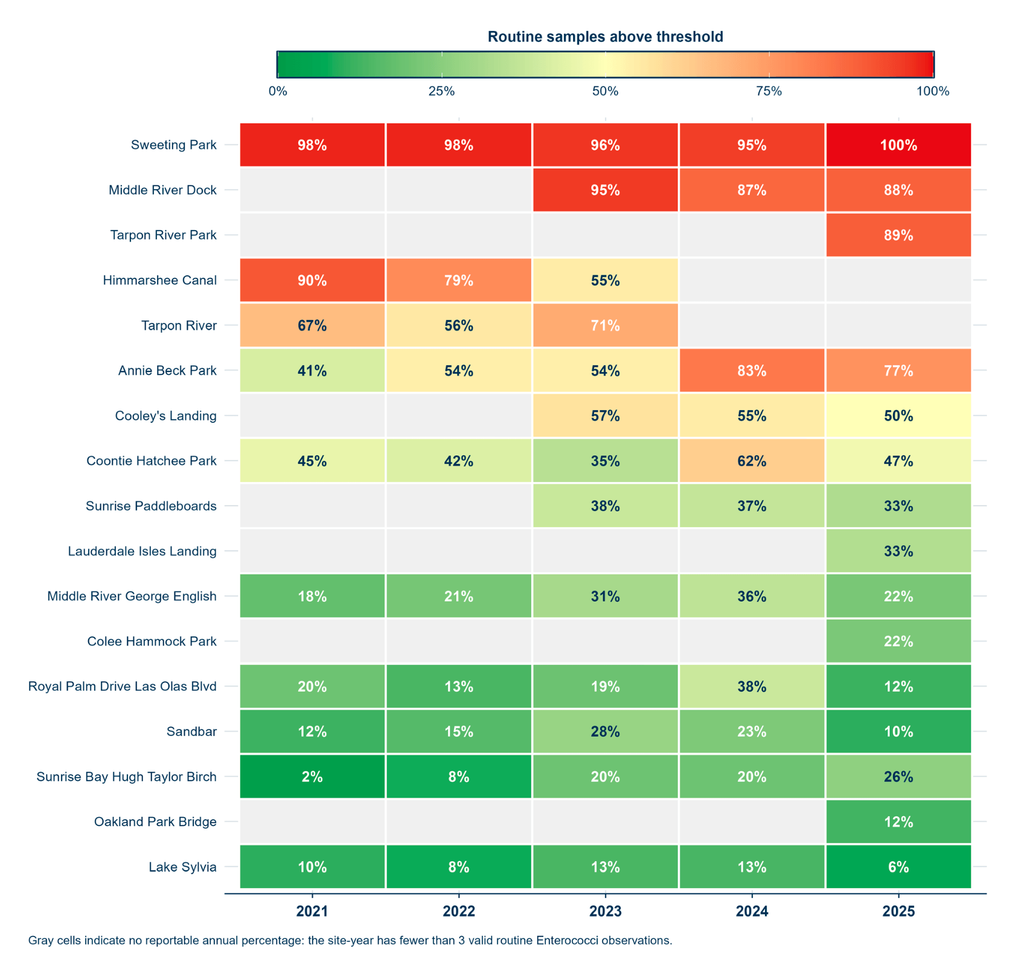
Long-term monitoring showed that some sites have recurring bacteria concerns, including Sweeting Park, Middle River Dock, Manatee Bend Park, Annie Beck Park, and Jose Marti Park. The results also showed that not all waterways behave the same way. At Jose Marti Park, samples exceeded the recreational water-quality benchmark more often after rain. At Sweeting Park, bacteria levels stayed high even during dry conditions.
The main takeaway is simple: South Florida’s waterways are connected. Protecting Biscayne Bay and our coastal waters starts upstream, in the rivers, canals, storm drains, and neighborhoods that drain toward them.
Read Water Quality ReportHOW & WHY WE MONITOR
AND WHAT A BACTERIA TEST ACTUALLY TELLS YOU
We test the same sites week after week because water quality changes fast — rain, runoff, tides, and pollution events all move the numbers.
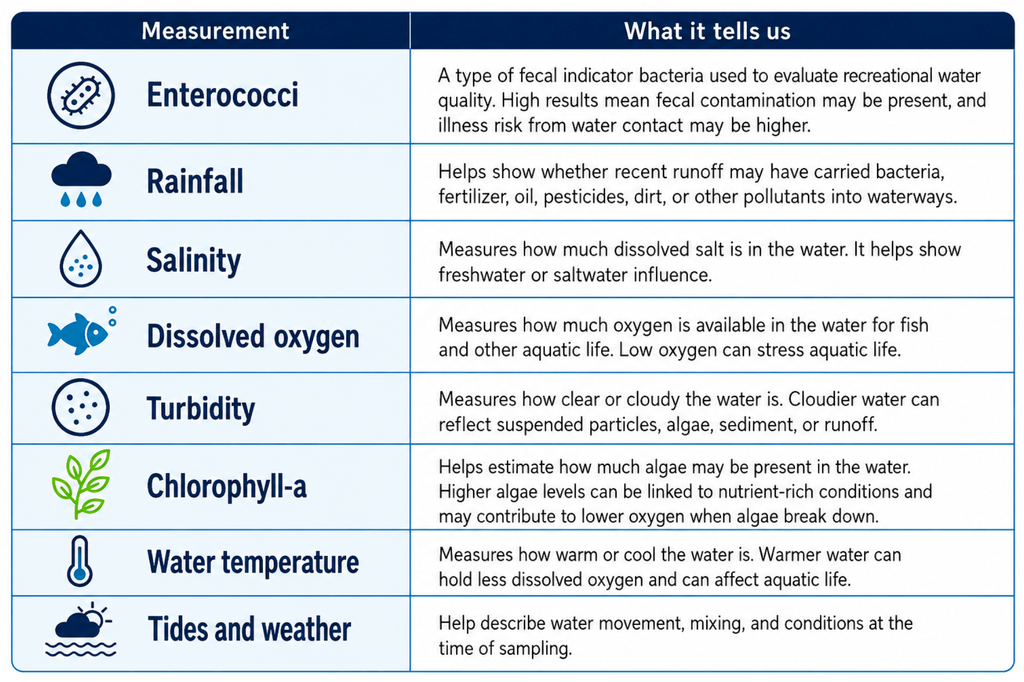
Our lab measures enterococci, a fecal-indicator bacteria: a high result doesn’t prove anyone will get sick by water contact, but it flags that contamination may be present and the risk from contact may be higher.
We track rainfall, salinity, oxygen, and other conditions alongside it to help explain what’s driving the results.
 Read Water Quality Report
WHERE WE TEST
33 SITES FROM FORT LAUDERDALE TO KEY BISCAYNE
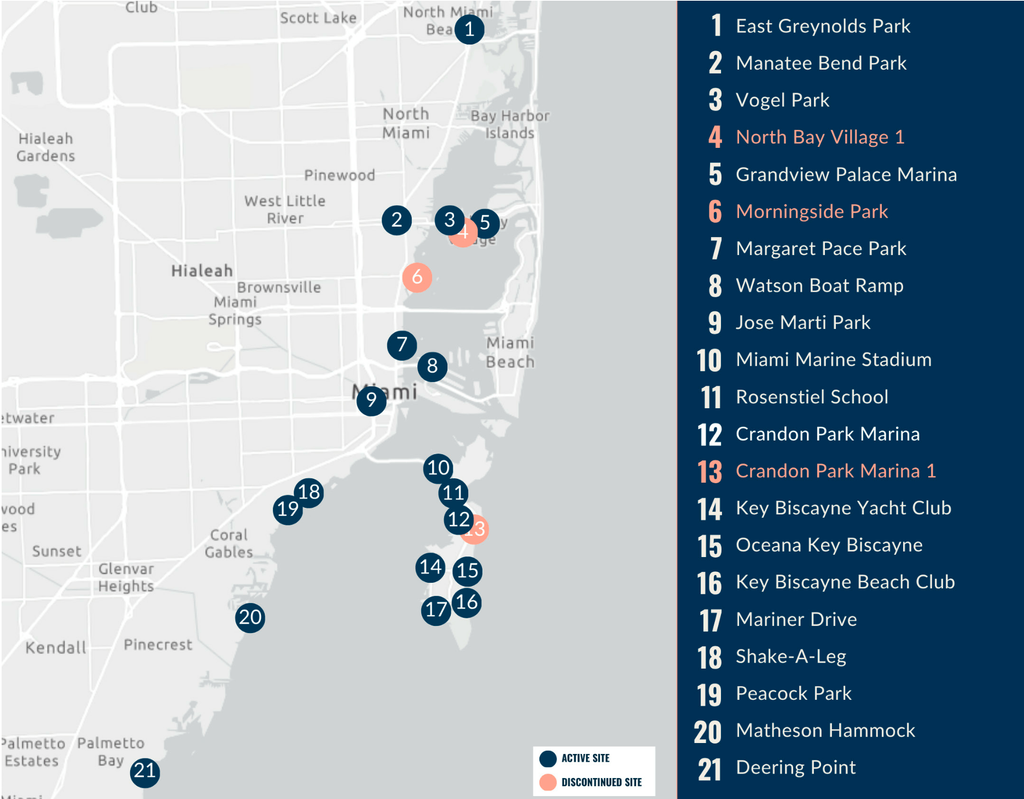
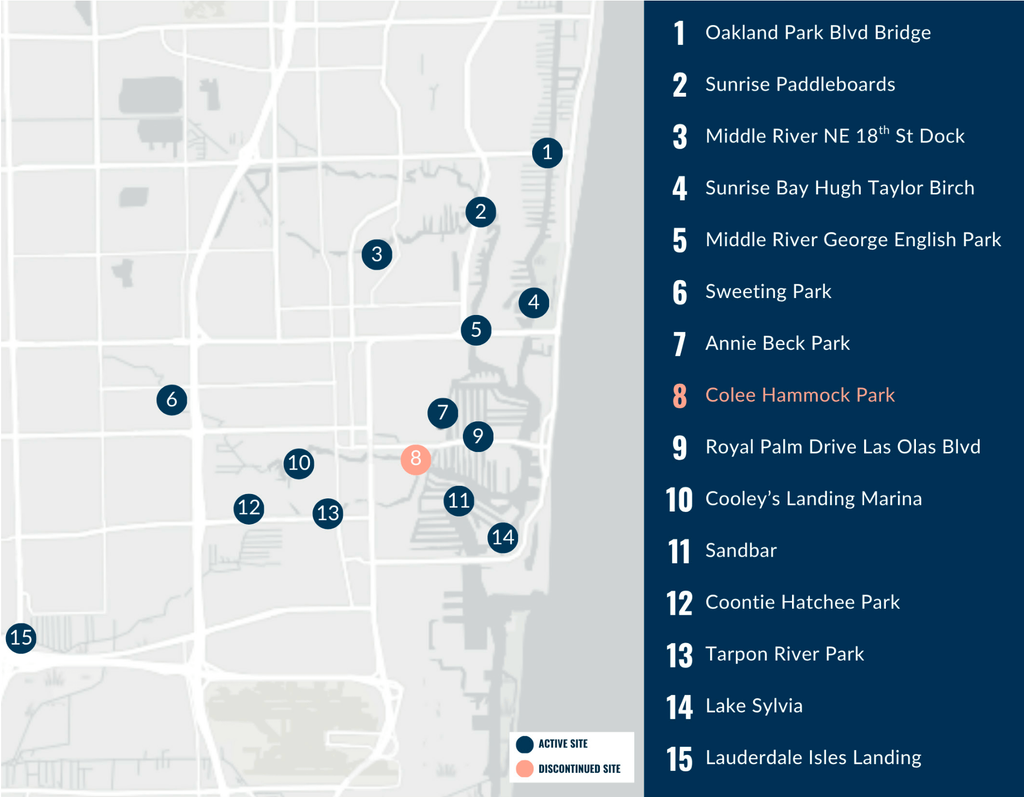
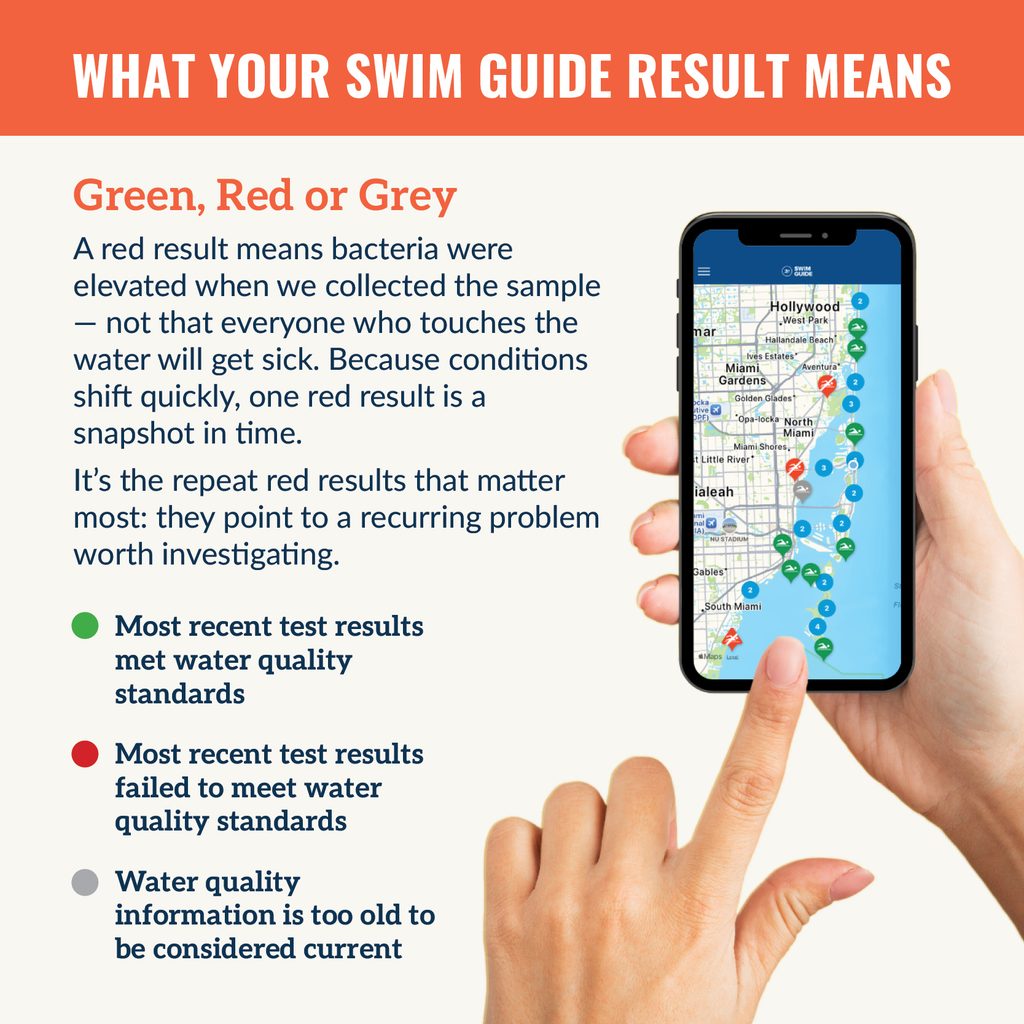
Our sites span inland canals and rivers, Biscayne Bay, the Intracoastal Waterway, and ocean beaches — the places where people actually swim, paddle, fish, and boat. Results are shared free every week through the Swim Guide app.
MIAMI-DADE WATER QUALITY MAP
BROWARD WATER QUALITY MAP
 Check Swim Guide
WHAT WE FOUND IN 2025
POLLUTION STARTS UPSTREAM
South Florida’s waterways are connected. Rivers, canals, and storm drains carry runoff from neighborhoods, streets, and parking lots toward Biscayne Bay and the ocean — which is exactly where we saw the most contamination.
Elevated bacteria were most common in inland waterways.
Bacteria exceedances weren’t spread evenly. They clustered inland, then dropped the closer we got to open water:
- 52% of inland routine samples exceeded the benchmark (rivers & canals, n=628)
- 22% in Biscayne Bay & the Intracoastal (n=637)
- 10% at monitored ocean beaches (n=104)
 Read Water Quality Report
BROWARD: 2025 MONITORING RESULTS
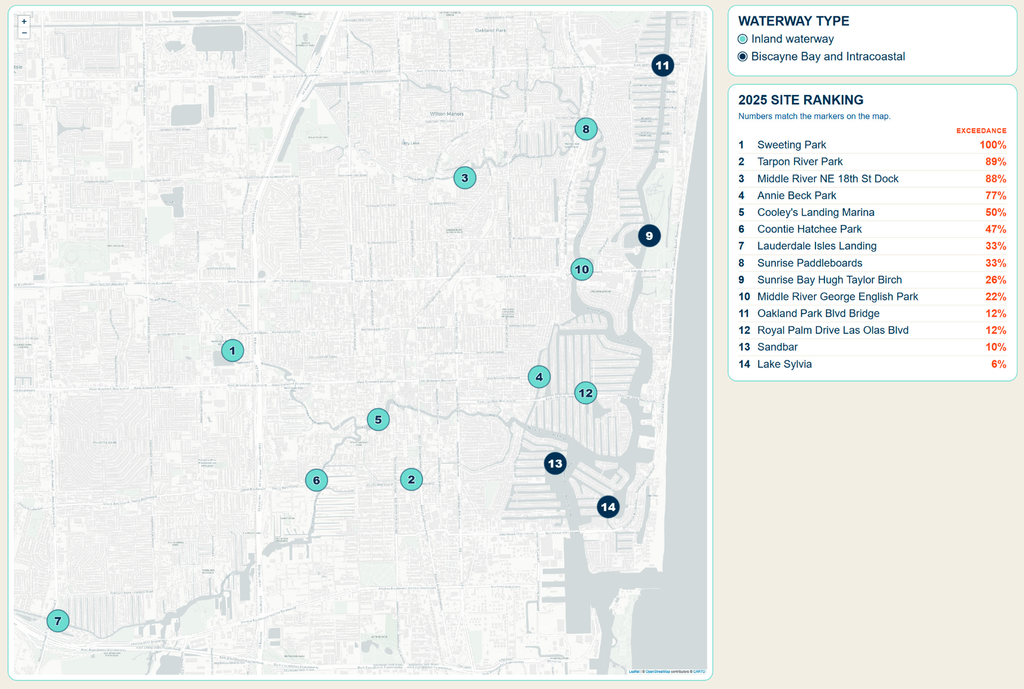
Broward’s highest exceedance rates concentrated along inland waterways — the North Fork of the New River, Middle River, and Las Olas Isles canals. Sweeting Park topped the entire network with a 100% exceedance rate. County-wide: 14 sites, 591 routine samples, a 43% exceedance rate.
BROWARD HOT SPOTS:
LONG-TERM PATTERNS OF ROUTINE SAMPLES ABOVE THE WATER-QUALITY BENCHMARK
MIAMI-DADE: 2025 MONITORING RESULTS
Miami-Dade’s highest 2025 rates were at Manatee Bend Park on the Little River (88%) and Deering Point (52%), followed by Jose Marti Park on the Miami River (45%). The Little River corridor has been a chronic hotspot — several sites there ran as high as 90–100% in recent years.
There was a bright spot, too: East Greynolds Park dropped to 41% of samples above the benchmark, down from 83% in 2024 and 80% in 2023 — though it’s still the most elevated active site in its area.
The problem wasn’t limited to rivers and canals. Biscayne Bay sites had recurring exceedances too, led by Margaret Pace Park (42%), Miami Marine Stadium (38%), and Peacock Park (32%). County-wide: 19 sites, 778 routine samples, a 28.5% exceedance rate.
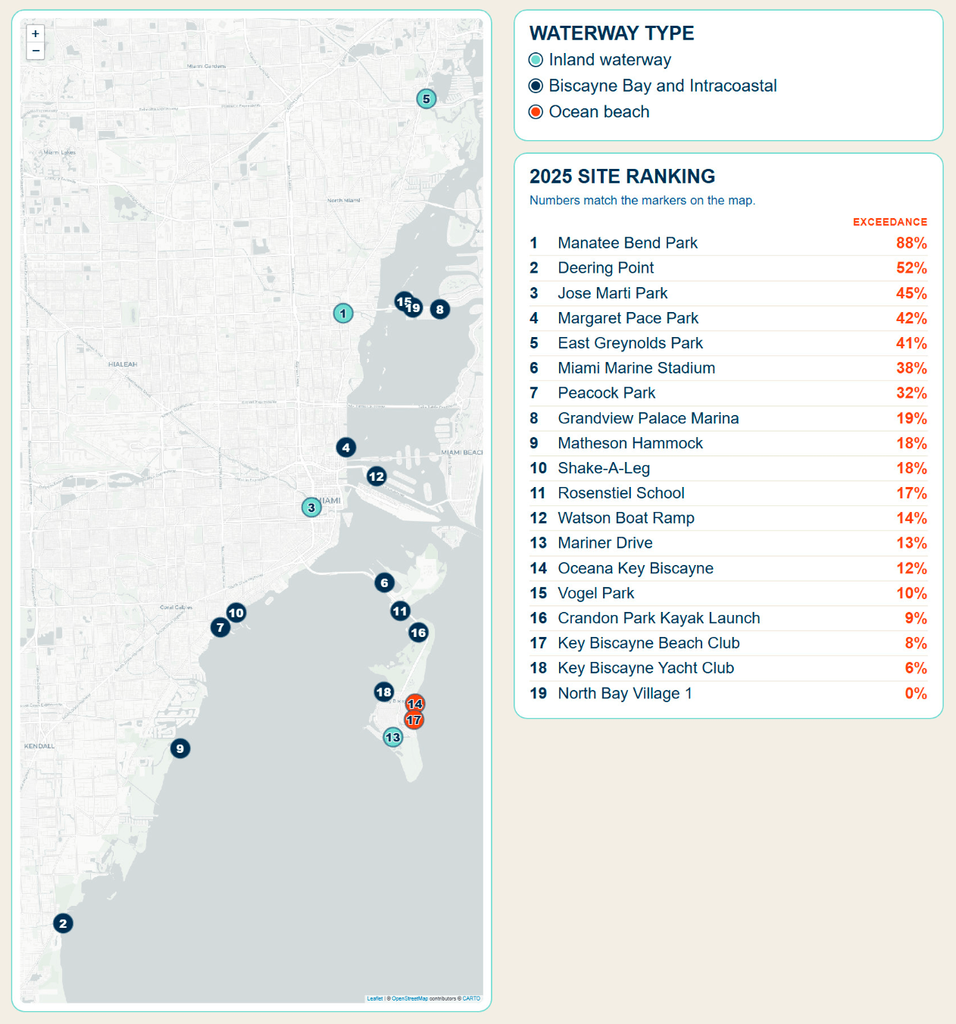
MIAMI-DADE NORTH NORTH BAY HOT SPOTS:
LONG-TERM PATTERNS OF ROUTINE SAMPLES ABOVE THE WATER-QUALITY BENCHMARK
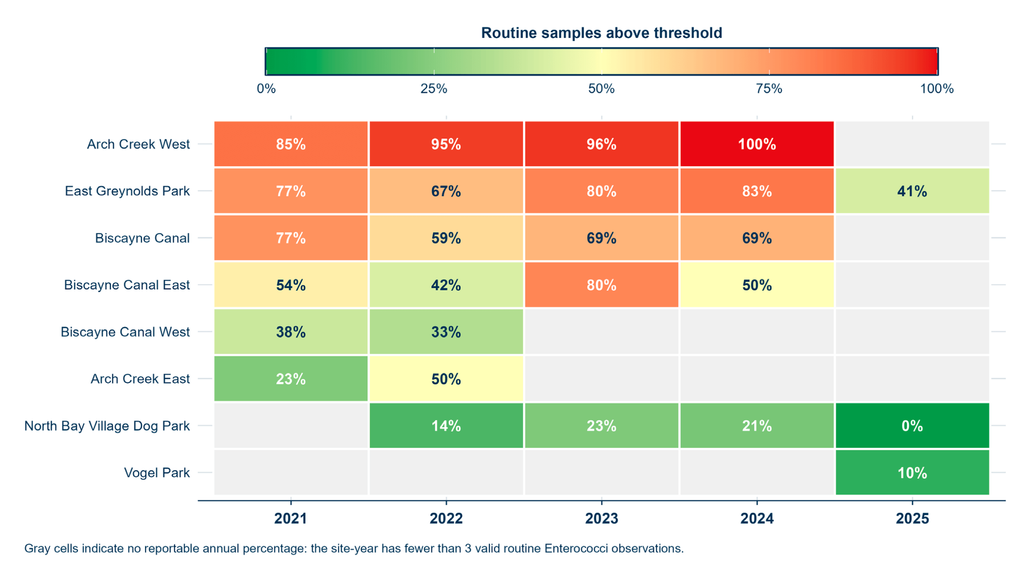
MIAMI-DADE SOUTH NORTH BAY HOT SPOTS
LONG-TERM PATTERNS OF ROUTINE SAMPLES ABOVE THE WATER-QUALITY BENCHMARK
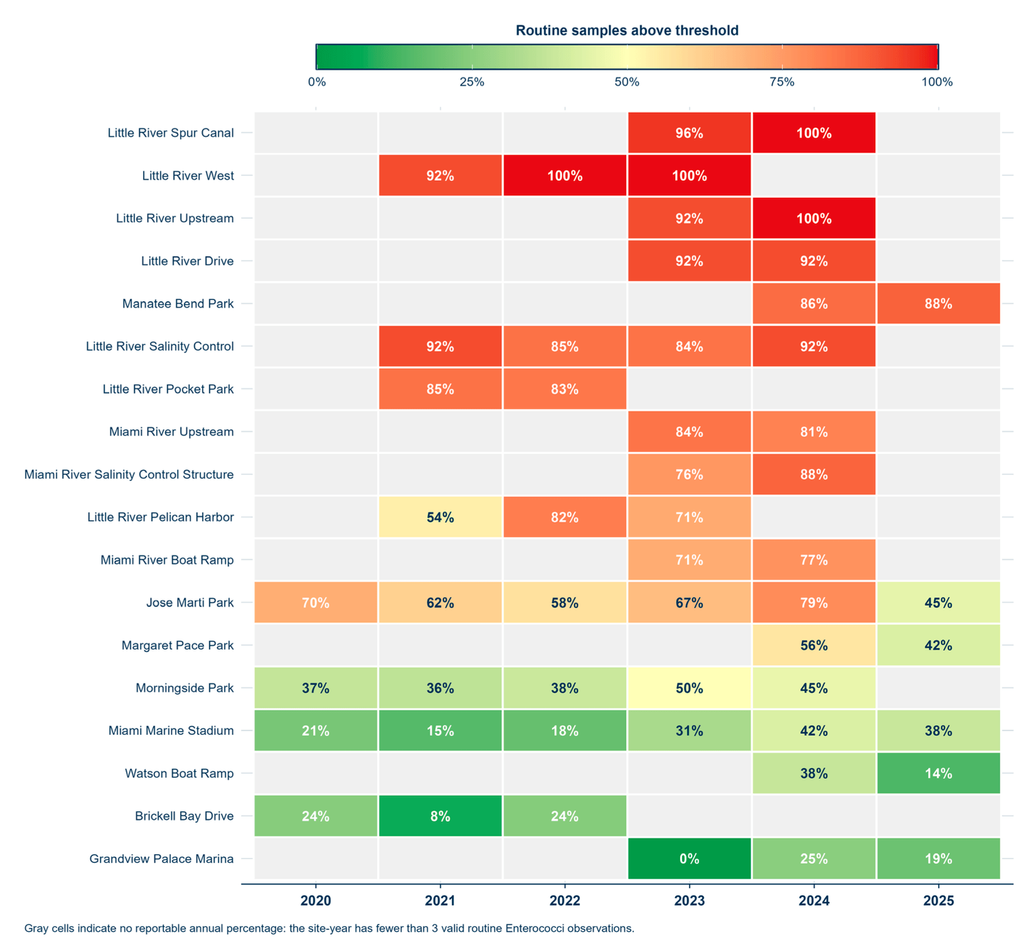
SOME SITES STAY ELEVATED YEAR AFTER YEAR
SWEETING PARK FAILED EVERY SINGLE TEST
A single year is a snapshot; long-term monitoring reveals the pattern. A handful of sites — Sweeting Park, Middle River Dock, Manatee Bend Park, Annie Beck Park, and Jose Marti Park — show recurring bacteria concerns. And not every site behaves the same way:
- Jose Marti Park climbs after rain — 48% exceedances in dry conditions, 93% after heavy rain — pointing to stormwater carrying bacteria into the river as a major pollution source.
- Sweeting Park stays high in both dry and wet conditions (97–100%) — a sign of a more persistent source, not just runoff.
LOOKING AHEAD
TURNING DATA INTO CLEANER WATER
We’ll keep monitoring, keep strengthening our long-term datasets, and keep using tools like microbial source tracking to pin down where bacteria are coming from.
The goal isn’t just to collect data — it’s to turn science into action that protects people, wildlife, and the water we all depend on.
WHAT YOU CAN DO
- Pick up after your pet — a direct source of bacteria, even far from the coast
- Keep litter, yard debris, and chemicals away from storm drains
- Use fertilizer responsibly — nitrogen and phosphorus fertilizers are banned in Miami-Dade from May 15 to Oct. 31
- Support septic-to-sewer conversion in your neighborhood
- Recreate responsibly by keeping trash out of the water
- Report pollution you spot through DERM’s 24-hour line at 305-372-6955 or our 1,000 Eyes on the Water program
WHAT WE’RE ASKING OF LOCAL LEADERS
- Maintain and inspect stormwater infrastructure — storm drains, canals, and outfalls — as required under MS4 permits
- Accelerate septic-to-sewer projects in flood-prone and vulnerable areas
- Invest in source tracking to pinpoint where contamination begins
- Close the inspection gaps our Stormwater Report Card identified